

01
Factory events by shift
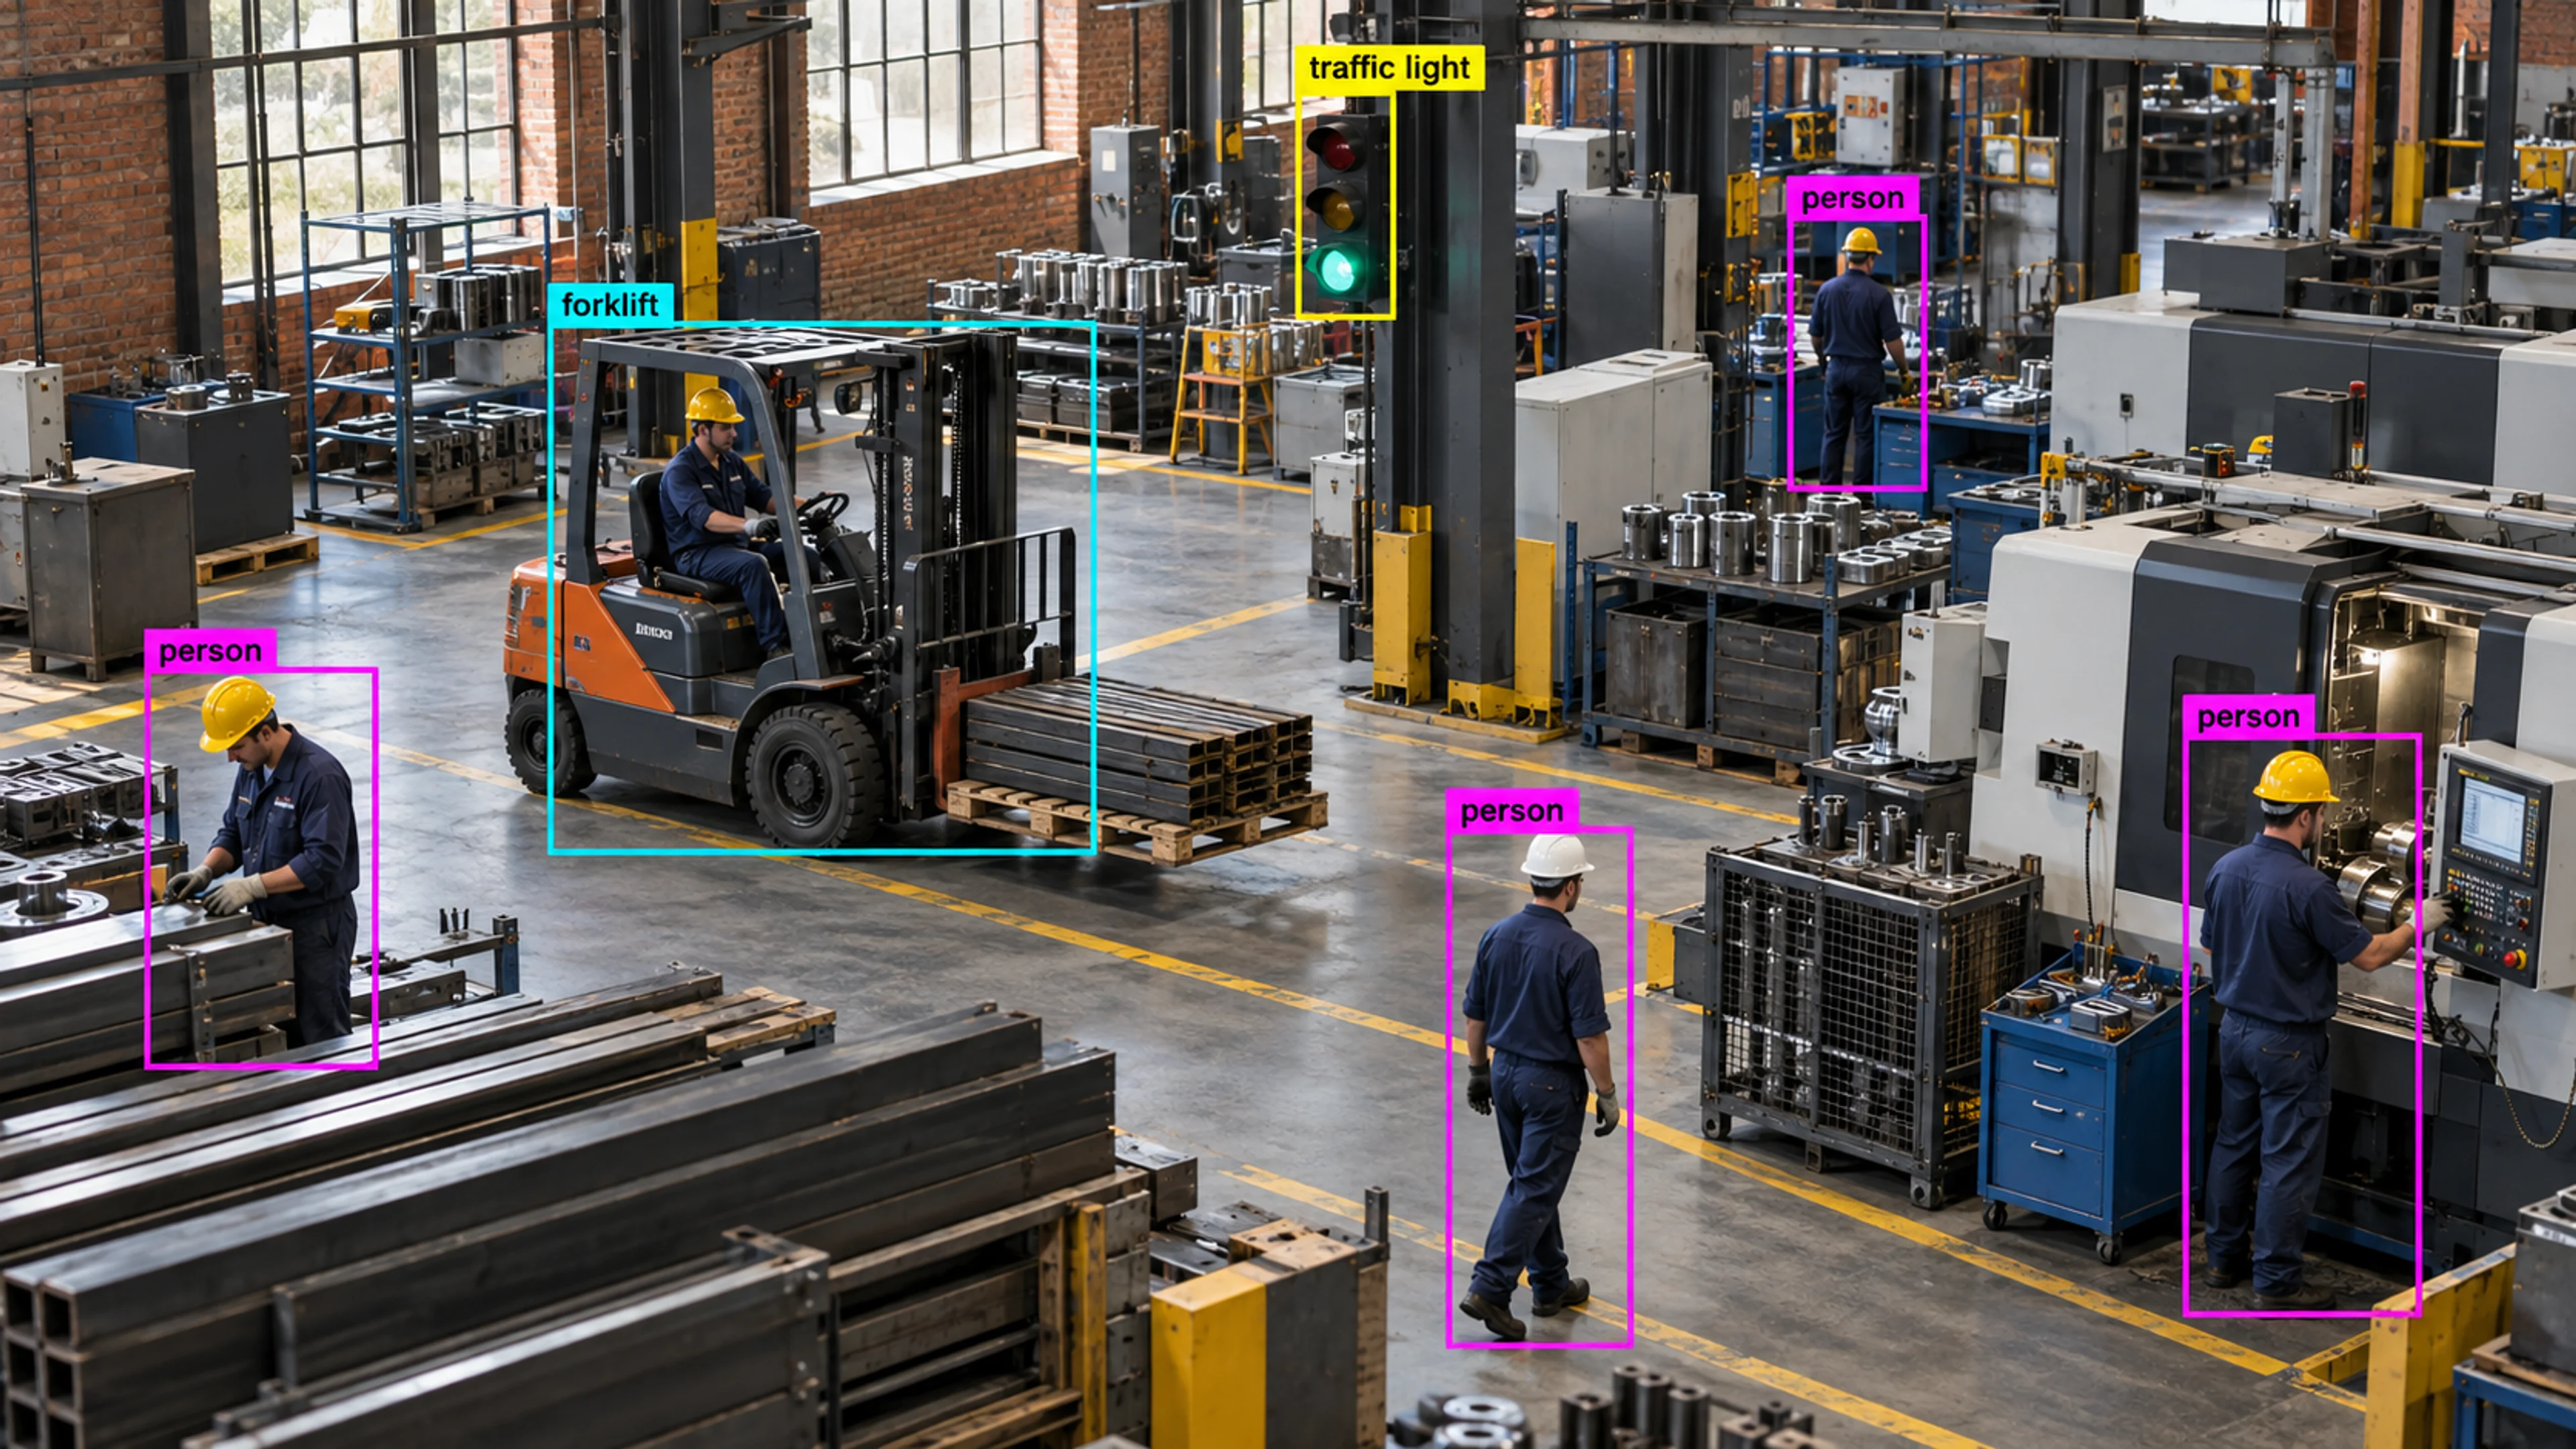
Incident counts by shift reveal that one shift generates most zone entries. The finding becomes the agenda for the next supervisor meeting.
Solution
Give teams a live understanding of facility activity, events, site health, and operational trends.
Operational Visibility
Illustrative environment · Warehousing & logistics
Overview
Operational Visibility is for teams that need to know what is happening across their facilities right now and what has been happening over time — events, site health, occupancy and throughput — without building a separate reporting stack.
It brings live monitoring, multi-site views and analytics together so operations leads can run a shift, a site or a region from one place.
Operations leaders do not need more dashboards. They need one that shows where attention is needed today and why.
What it does
Each part is configured around your cameras, zones and schedules — the same system, set up for the way your site runs.
Active alerts, camera health and status across sites in one workspace.
Events, occupancy and throughput over time, by site, zone and shift.
Alert volume, closure time and availability compared across locations.
Scheduled exports for operations reviews, with permissions scoped to each team.
In practice
Incident counts by shift reveal that one shift generates most zone entries. The finding becomes the agenda for the next supervisor meeting.
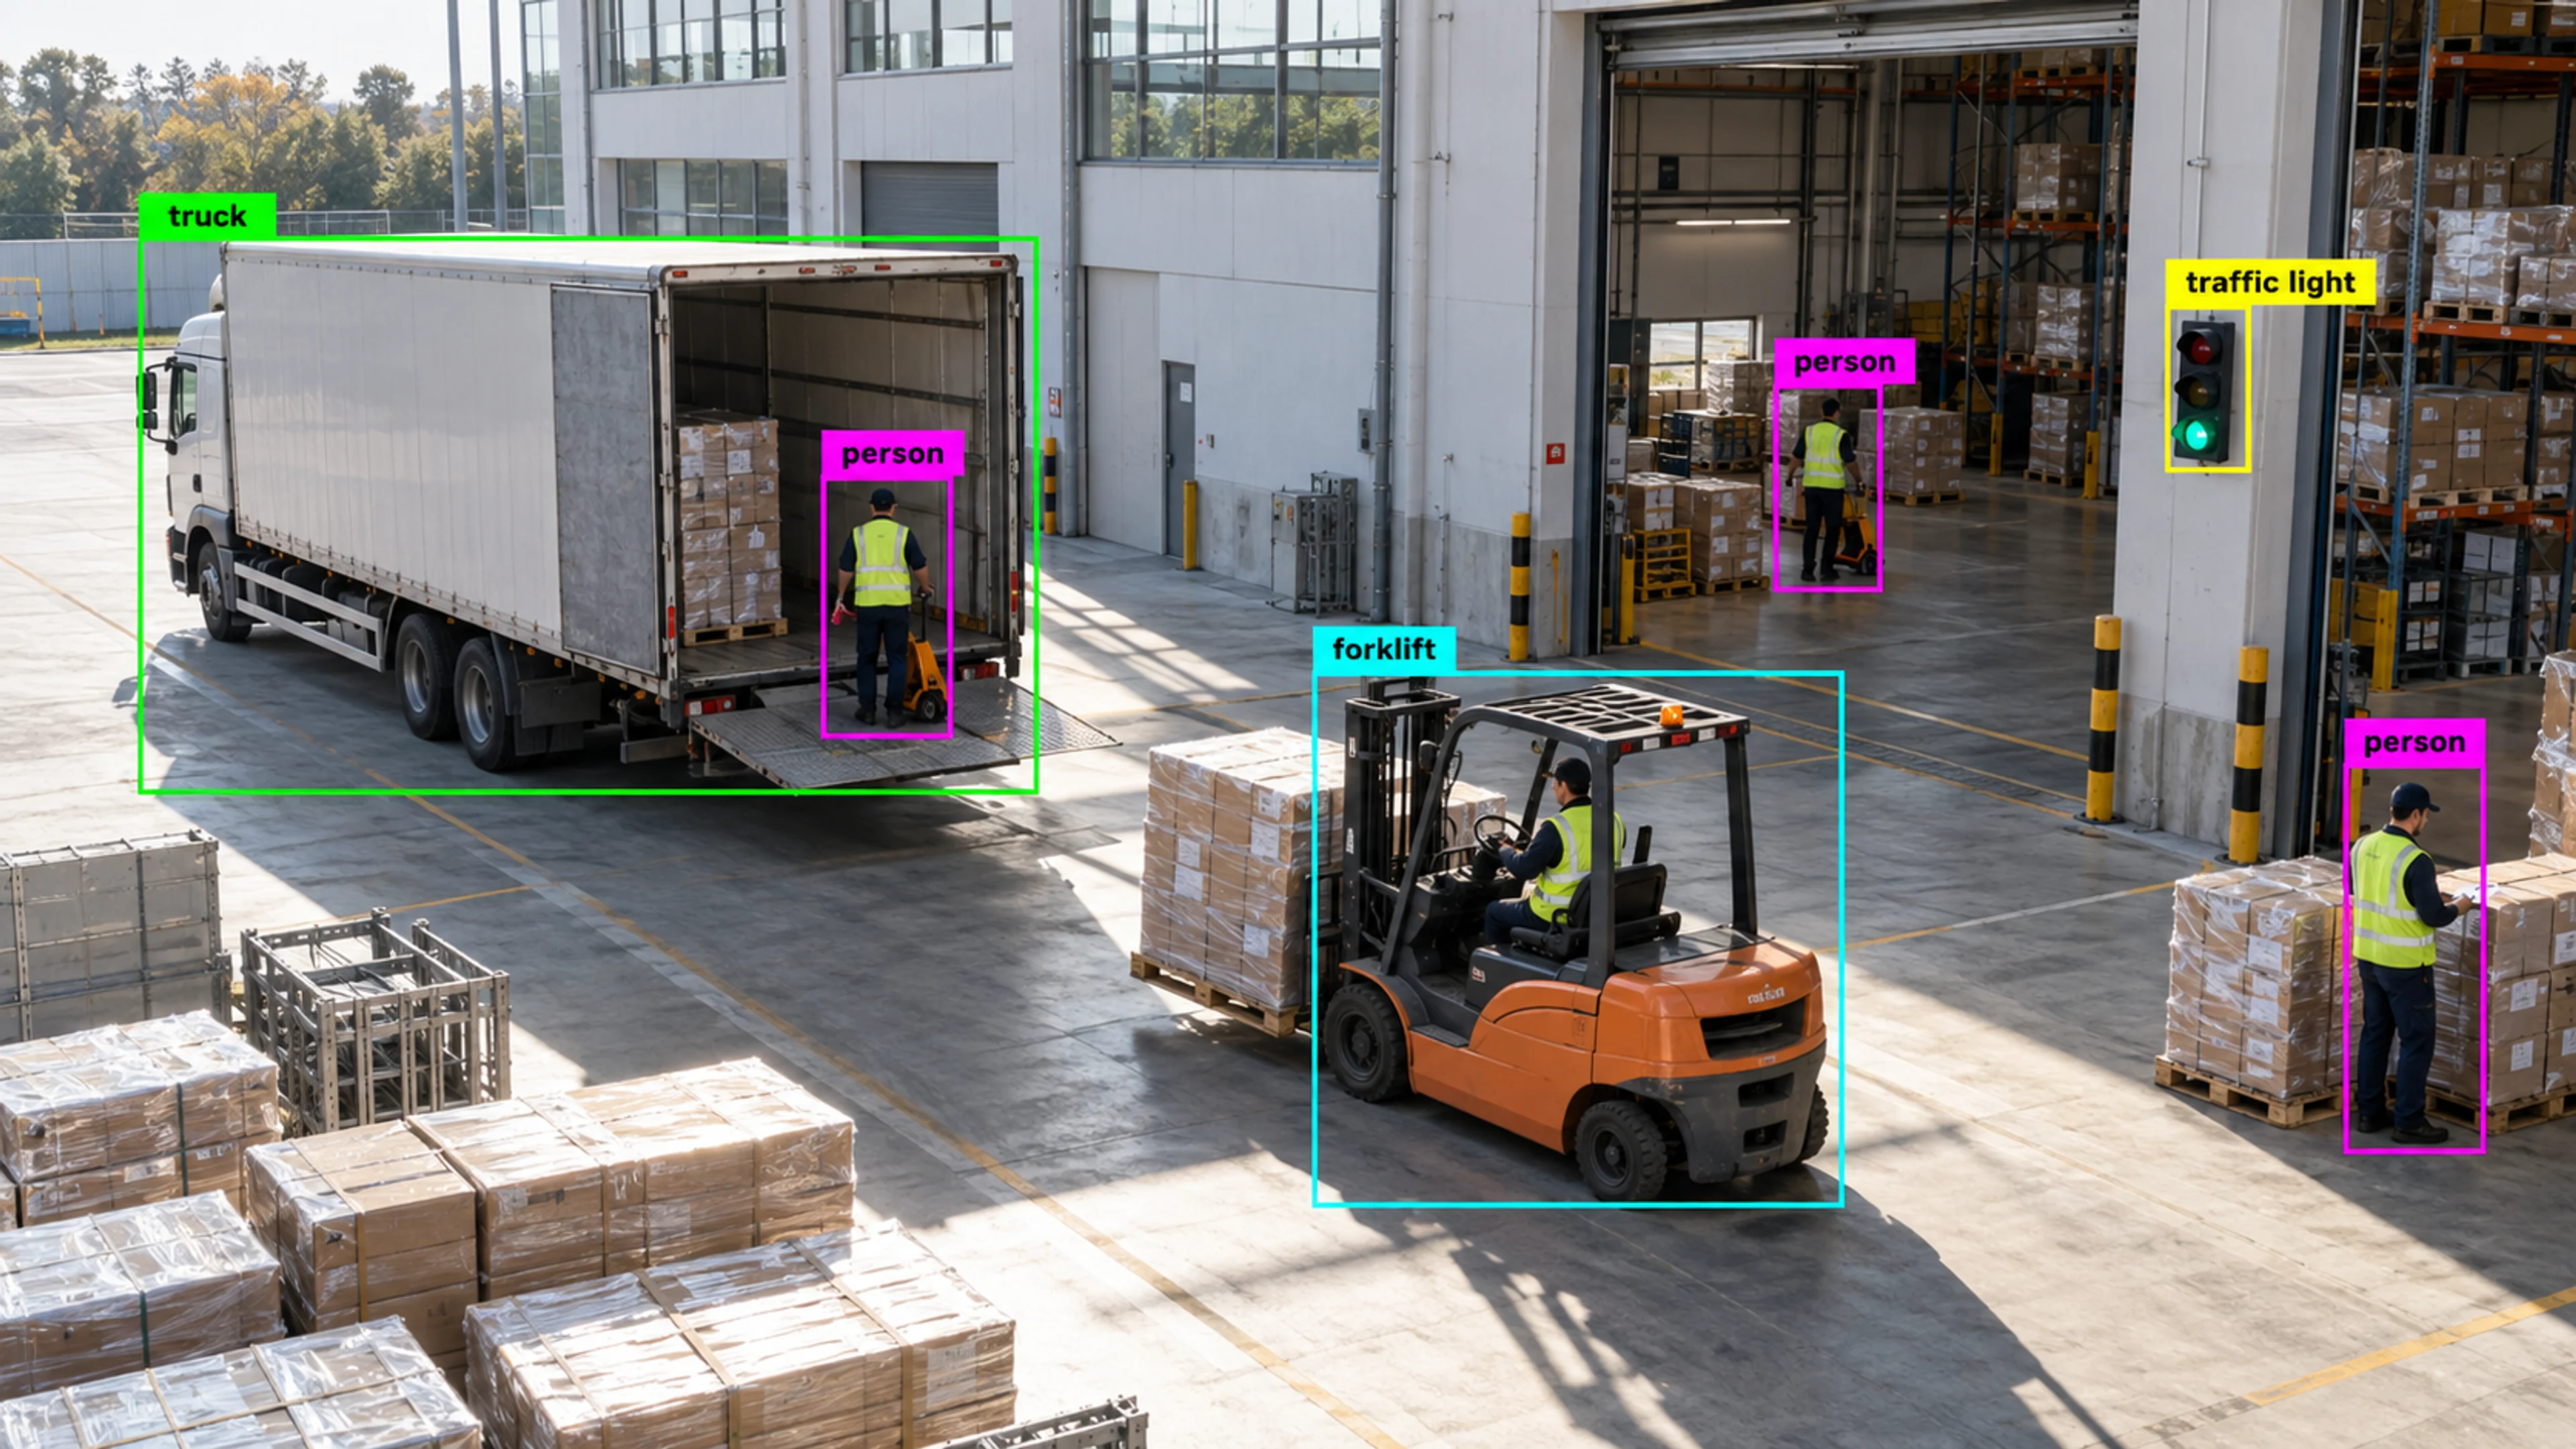
Dock occupancy and forklift activity by hour show where congestion builds. Dispatch adjusts bay allocation and tracks the result.
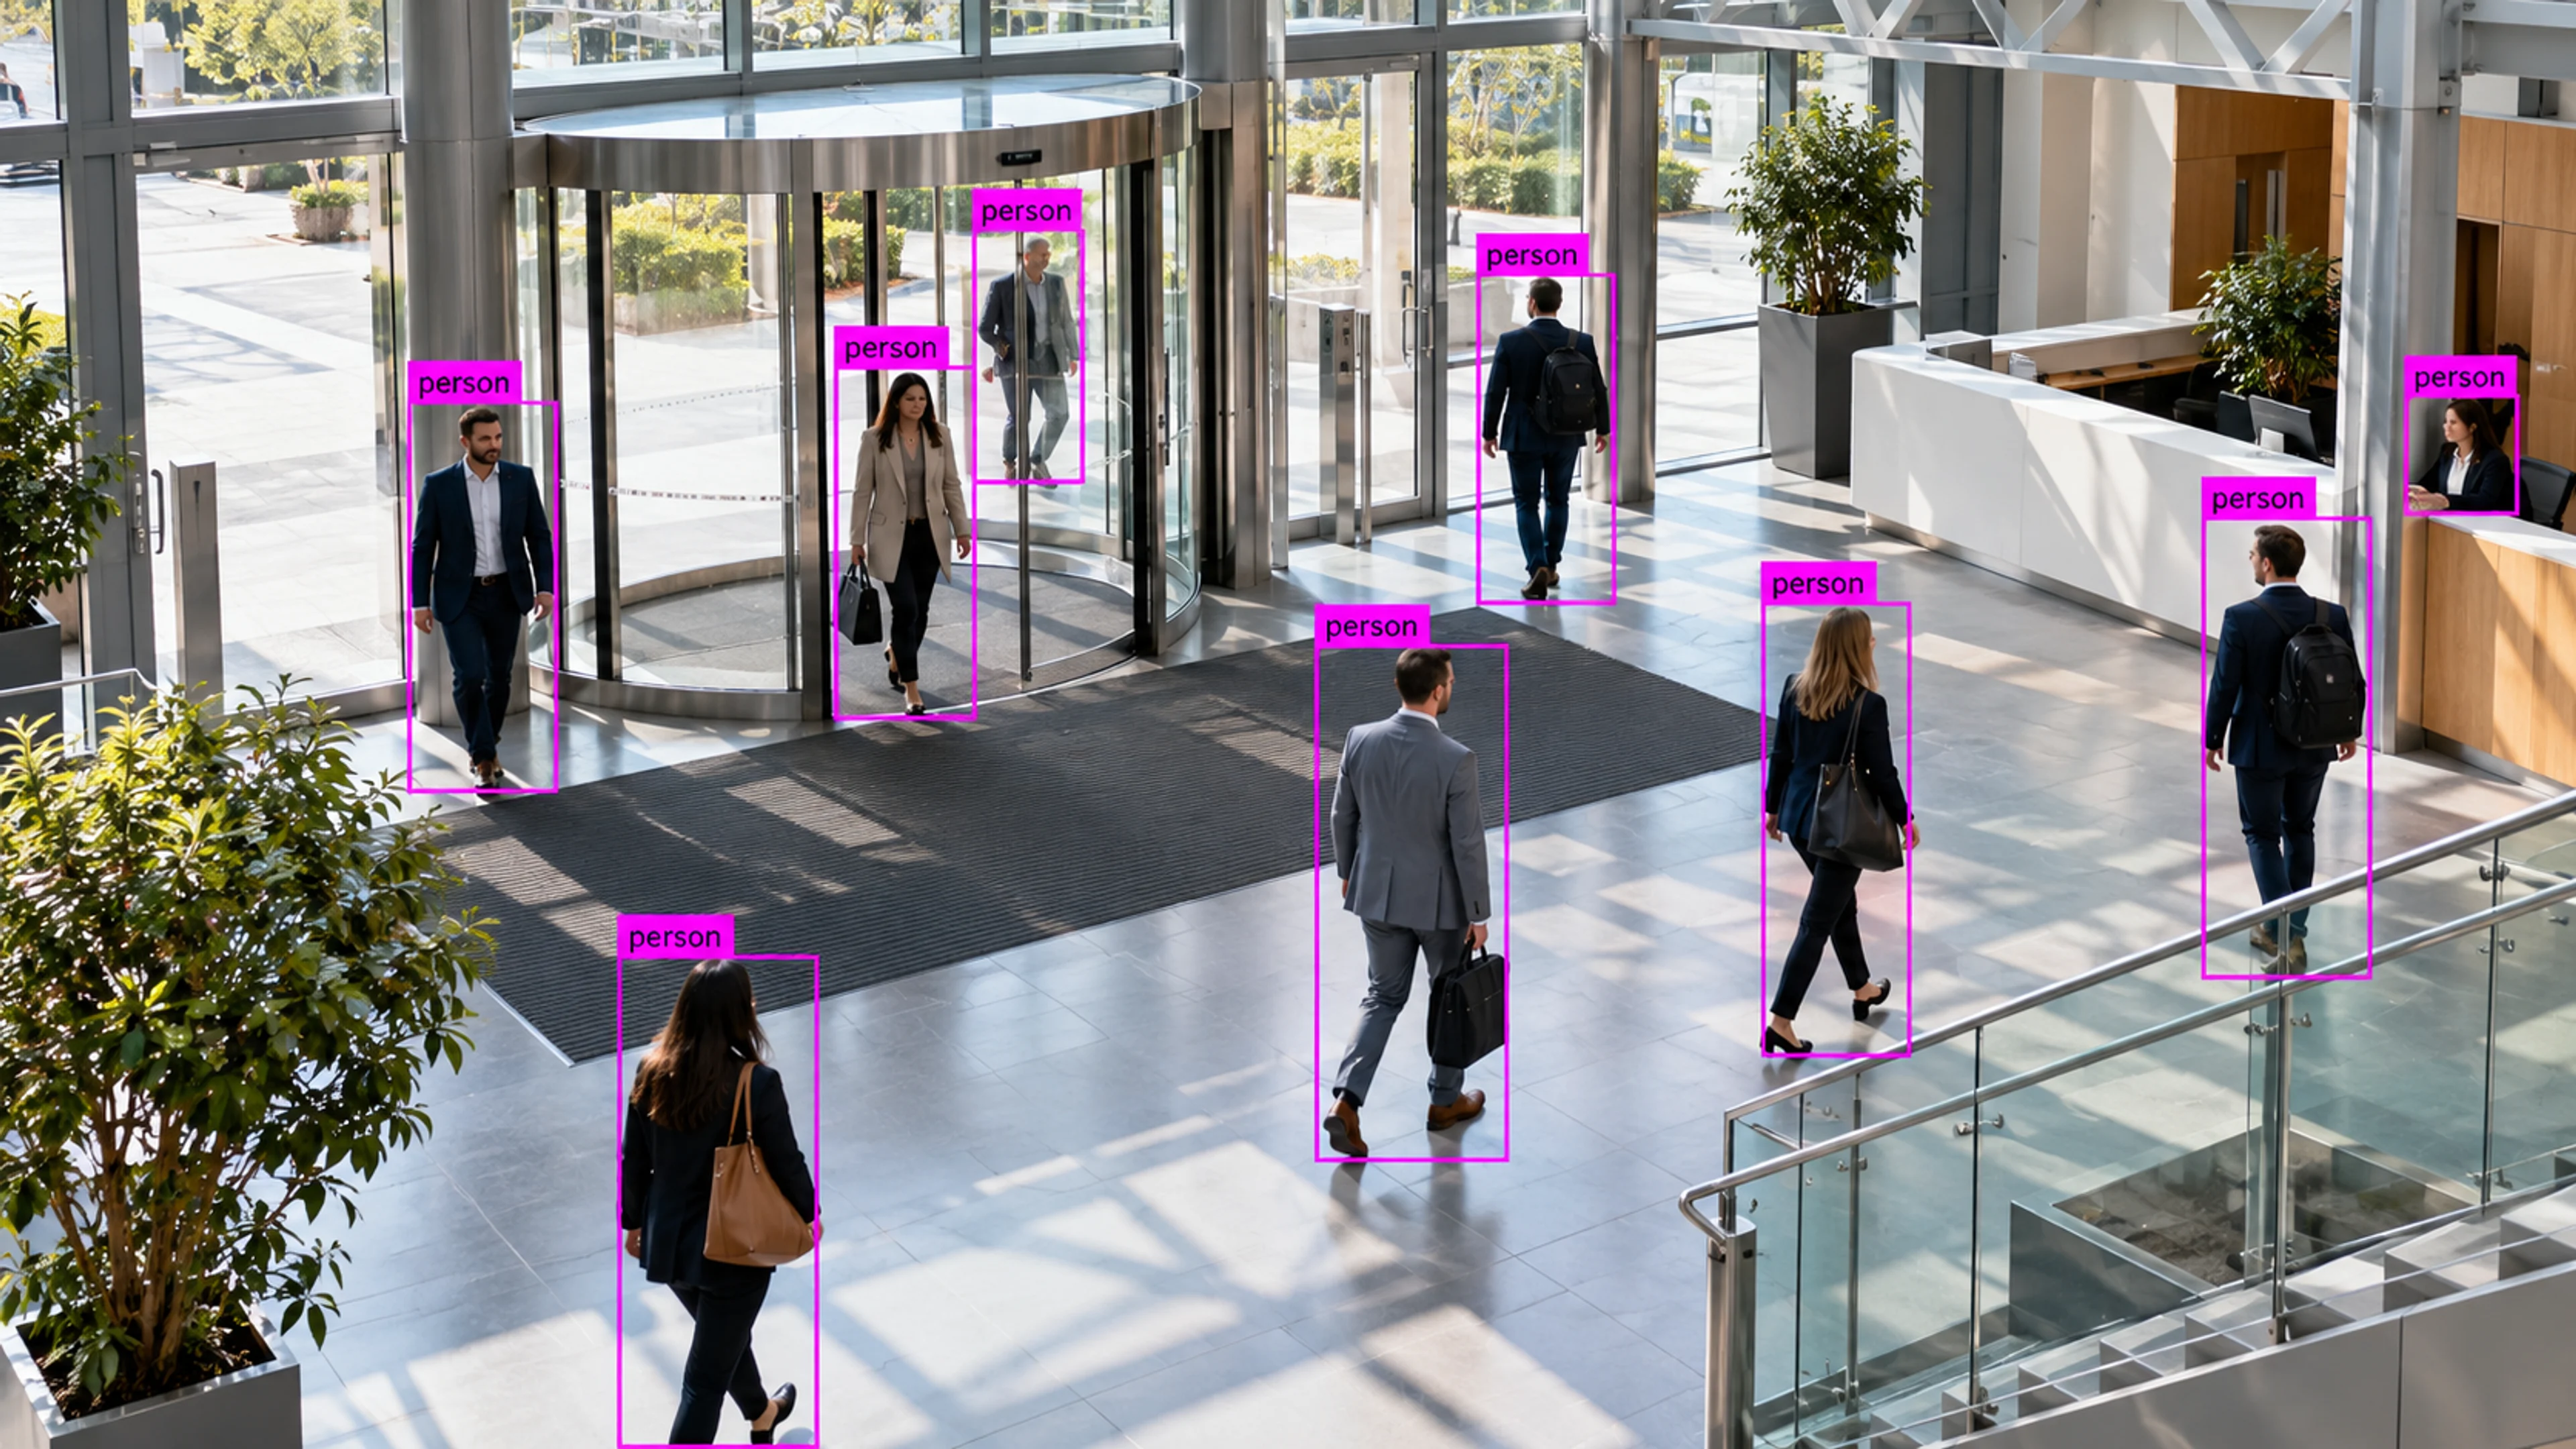
Floor utilisation over a quarter supports a consolidation plan, and the same reports measure the outcome.
Questions
Straight answers about how this is configured, what it needs and what it does not do.
Next step
Tell us about your sites and what you need to catch. We will walk through a setup that fits the way your operation runs.